
Aftermath: Trace-based Performance Analysis for OpenMP and OpenStream
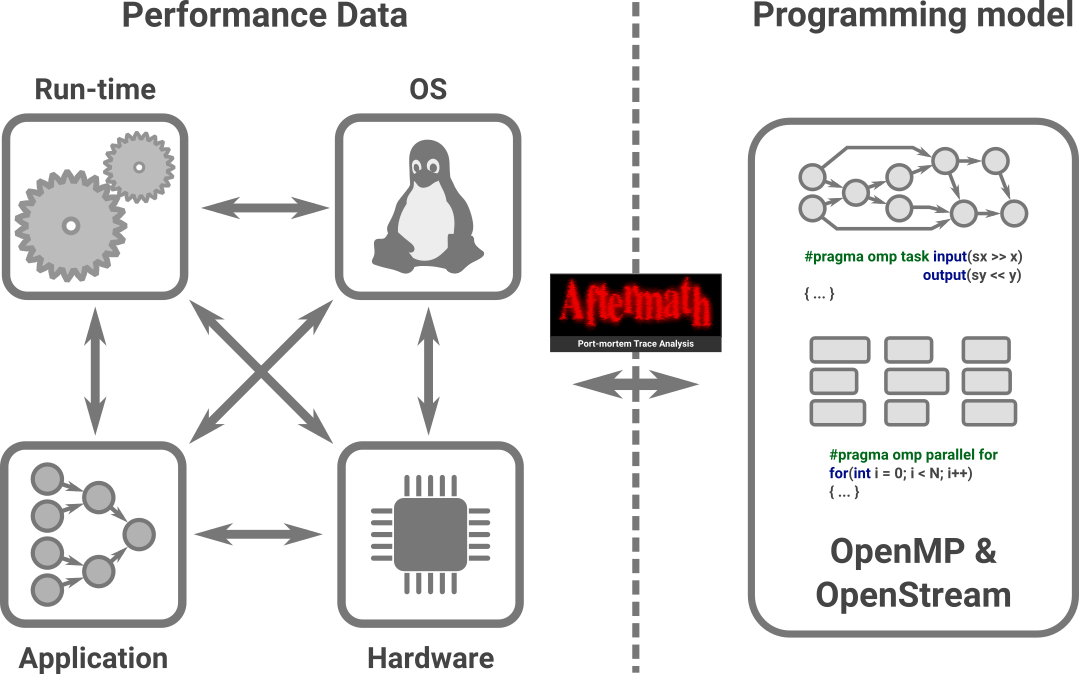
Aftermath is a graphical tool for the trace-based performance analysis of OpenMP and OpenStream programs. The tool allows programmers to relate performance data from a parallel execution to the programming model, e.g. to loops and tasks in OpenMP. Aftermath supports the interactive exploration of trace files, the generation of detailed statistics for arbitrary subsets of a trace on-the-fly and the inspection of individual events in detail. Aftermath is free software, released under the GNU GPL v2 and its tracing library is licensed under the GNU LGPL v2.1.For a quick impression of Aftermath check out the screenshots and the video. For more detailed information, please refer to the publications and the documentation. If you would like to try out Aftermath, you may want to download the virtual machine image or learn how to install Aftermath on your machine. Feel free to contact us.
Some of Aftermath's unique features
-
General
- Reactive user interface, even for large trace files
- Multiple, connected views for exploration, statistics and detailed analysis
-
OpenMP
- Visualization and detailed inspection of parallel loops
- Instrumented run-time based on the LLVM/clang OpenMP run-time
-
OpenStream
- Native support for dependent tasks
- Support for data-flow and task graph analysis
- Native support for NUMA

