
Screenshots
-
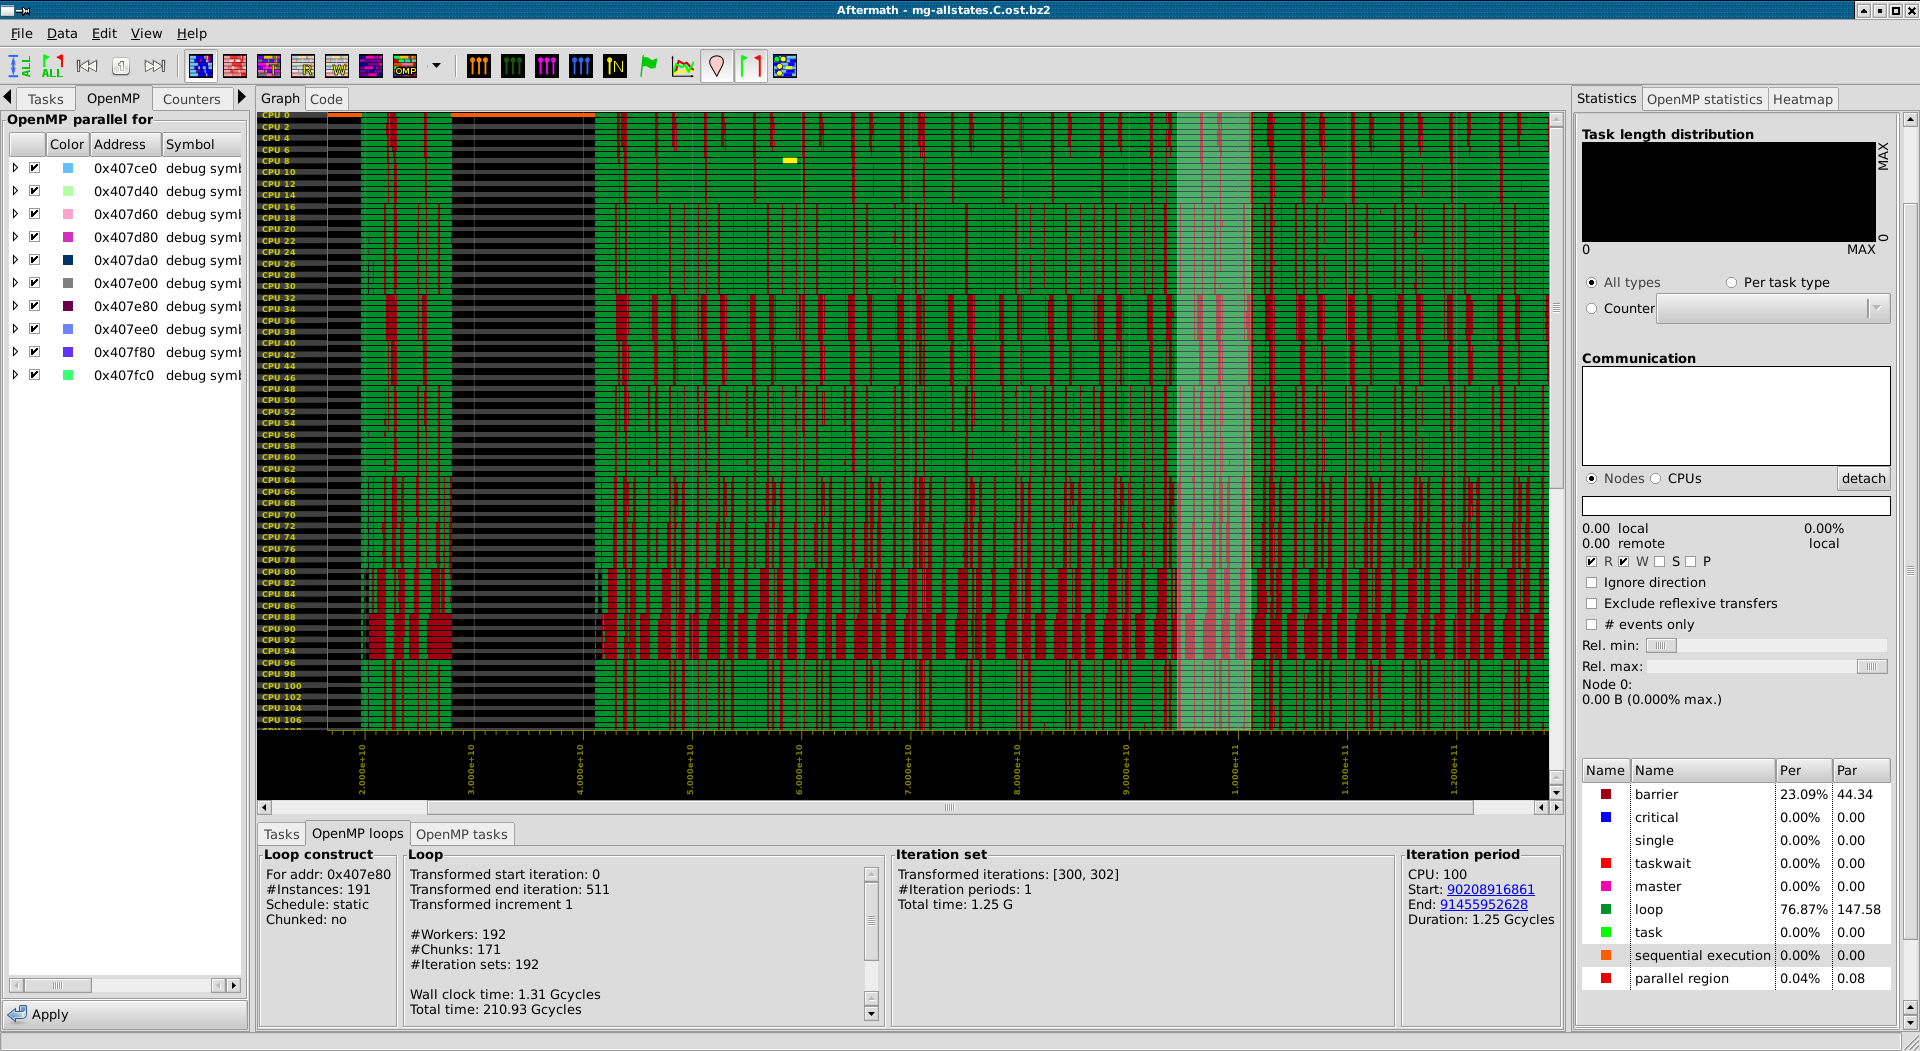
Visualization of OpenMP constructs (green: loop execution, red: barrier synchronization, orange: sequential execution)
-
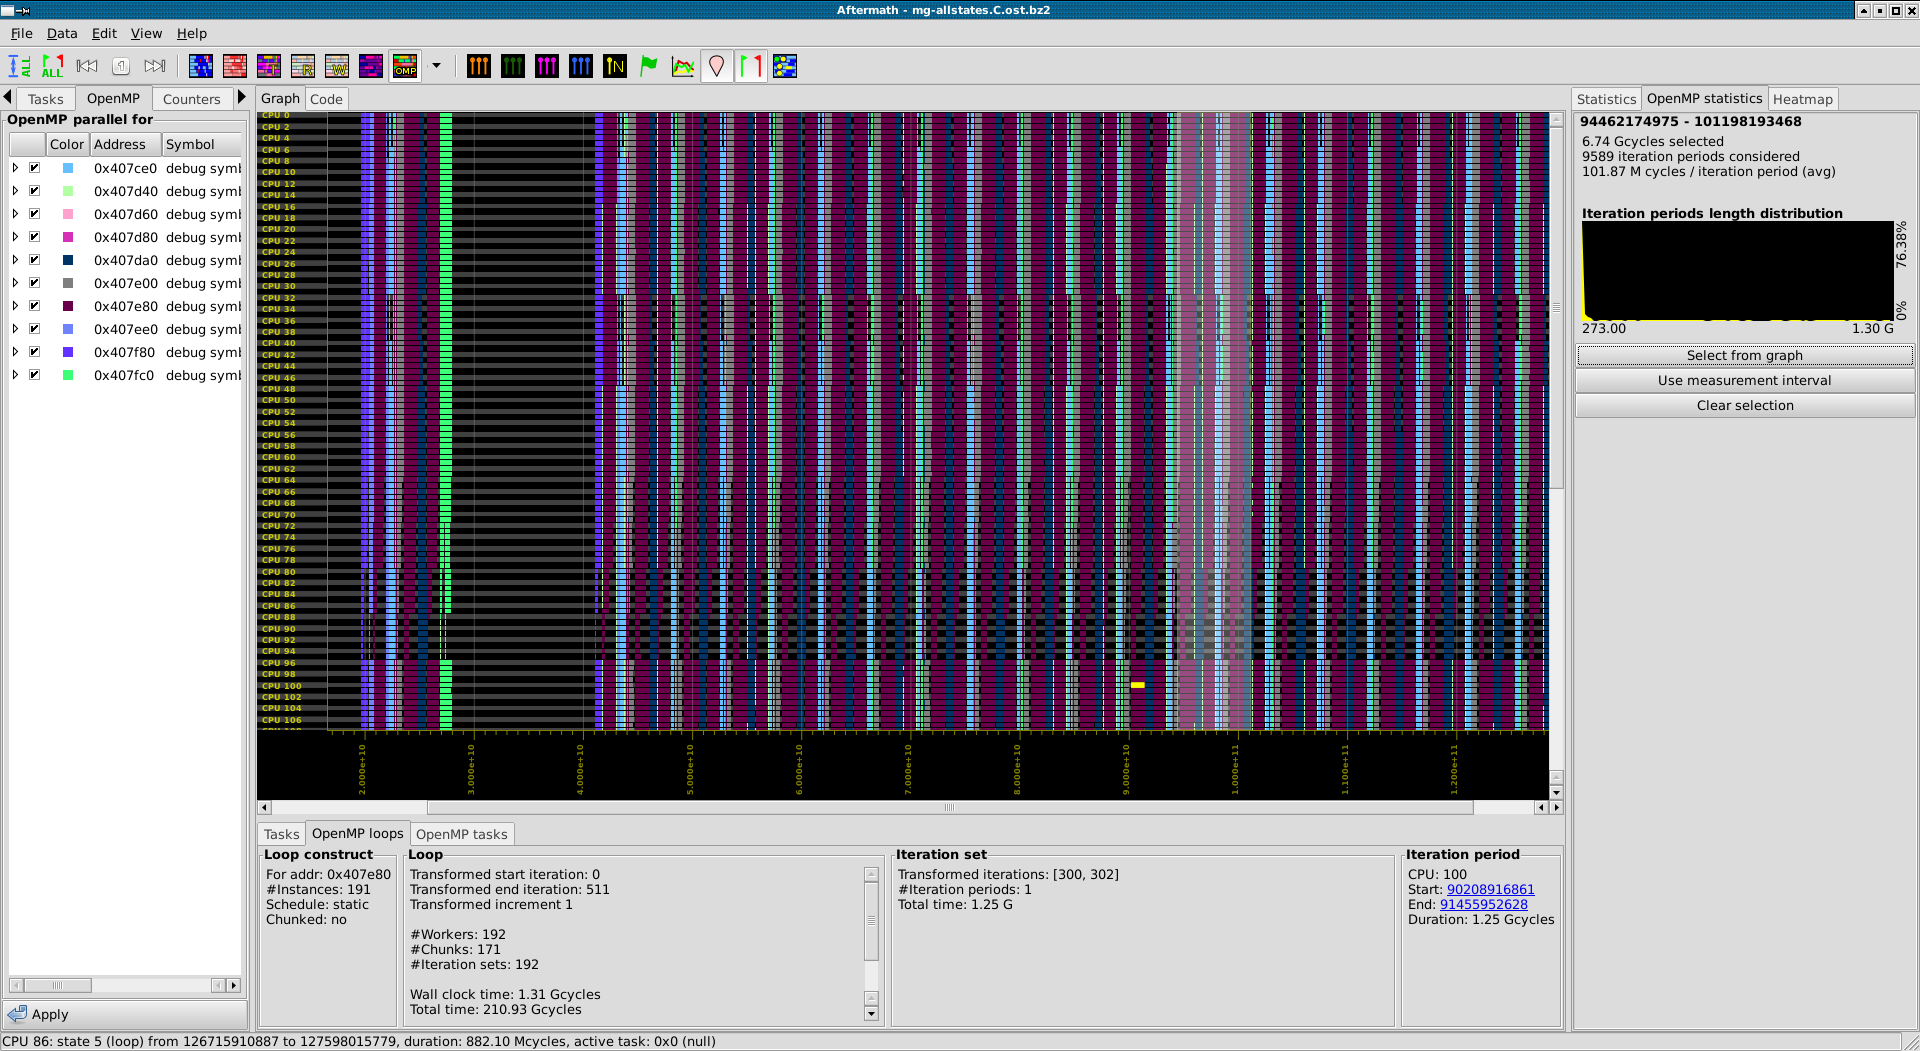
Visualization of OpenMP loop constructs (one color per loop construct)
-
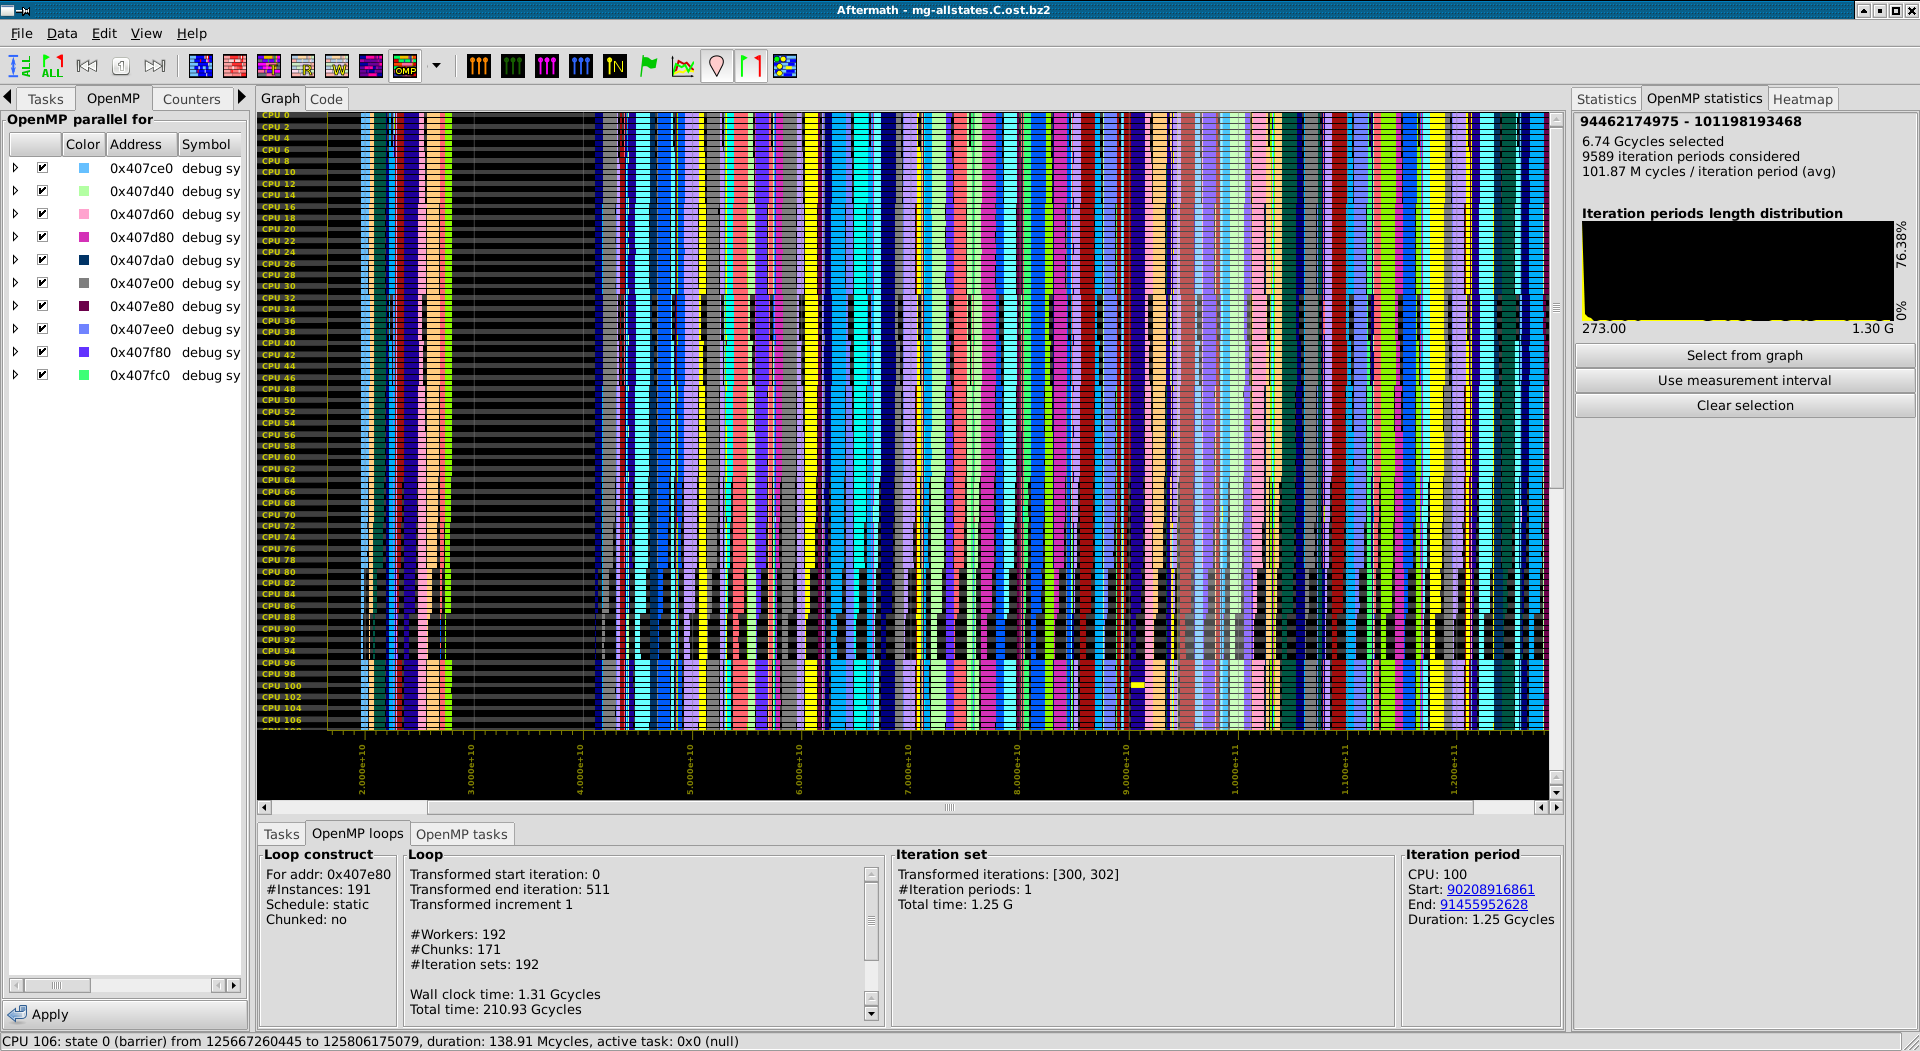
Visualization of OpenMP loops (one color per loop instance)
-
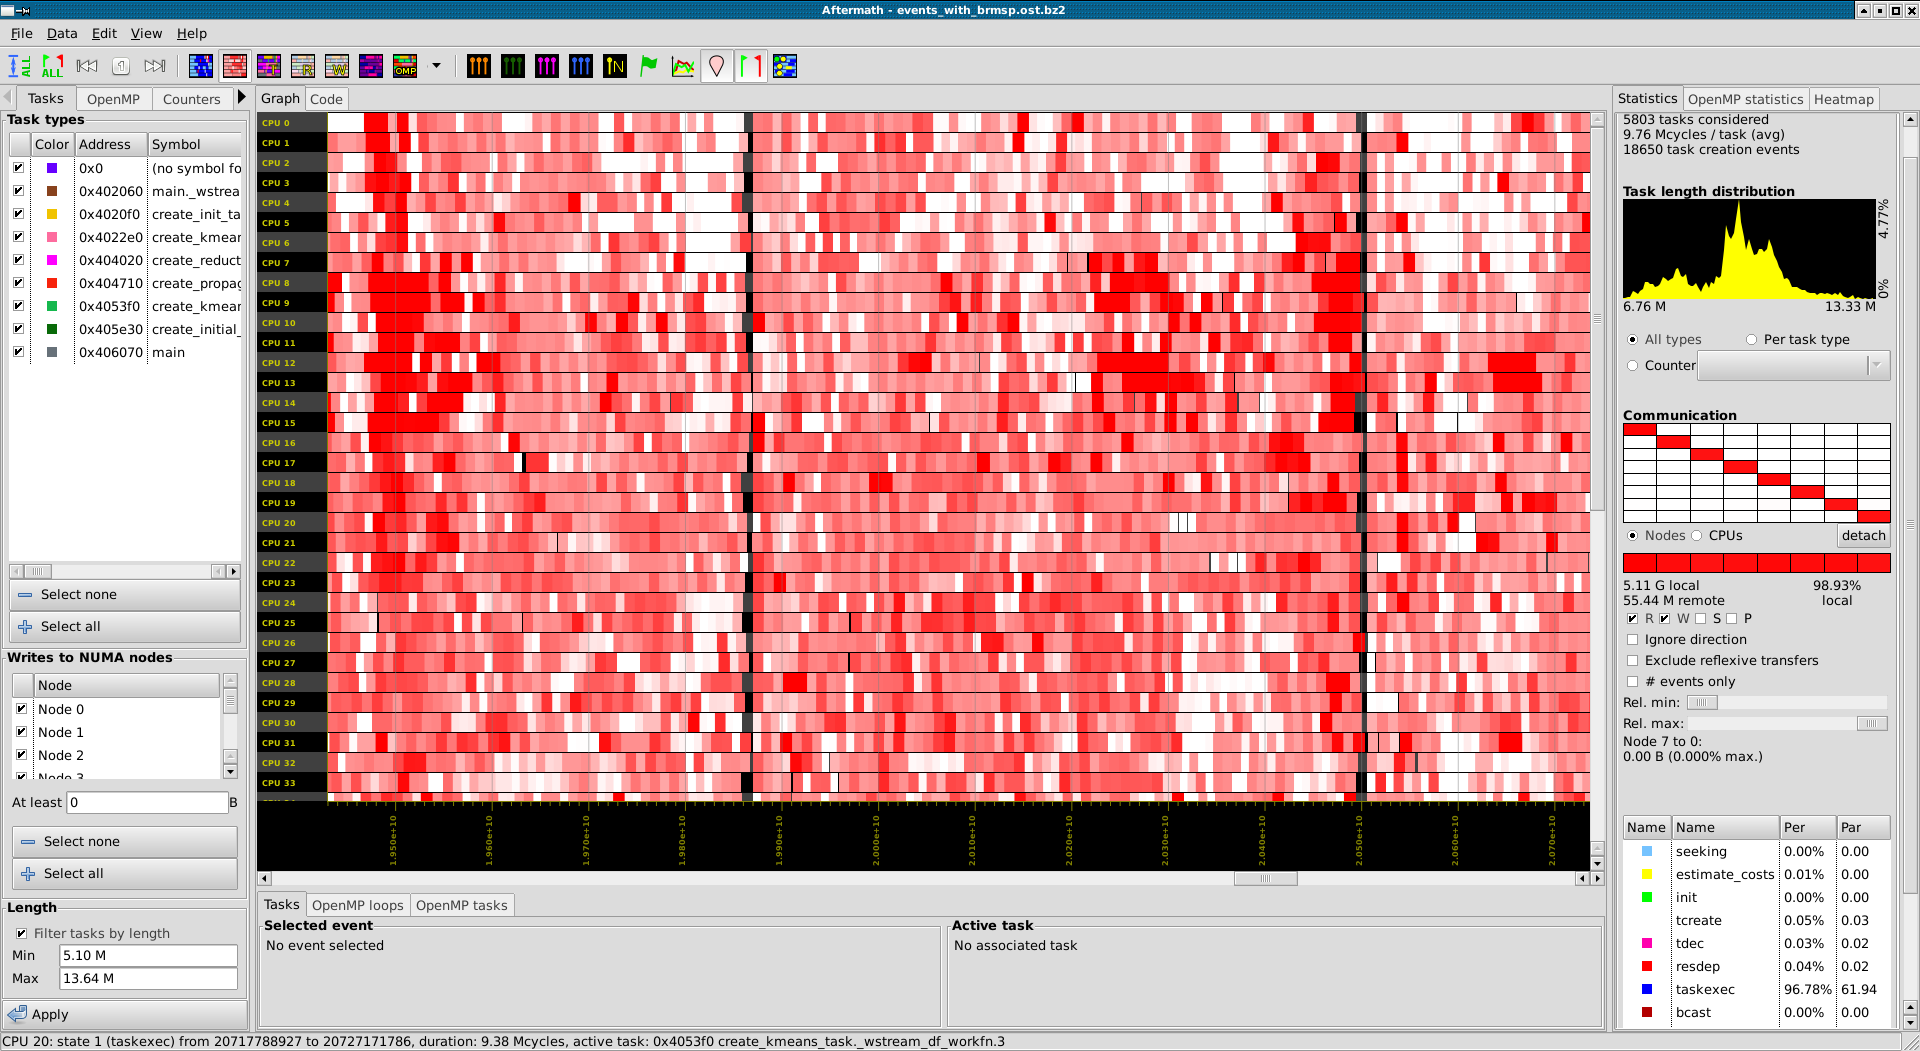
Visualization of the task duration with the time line in heatmap mode
-
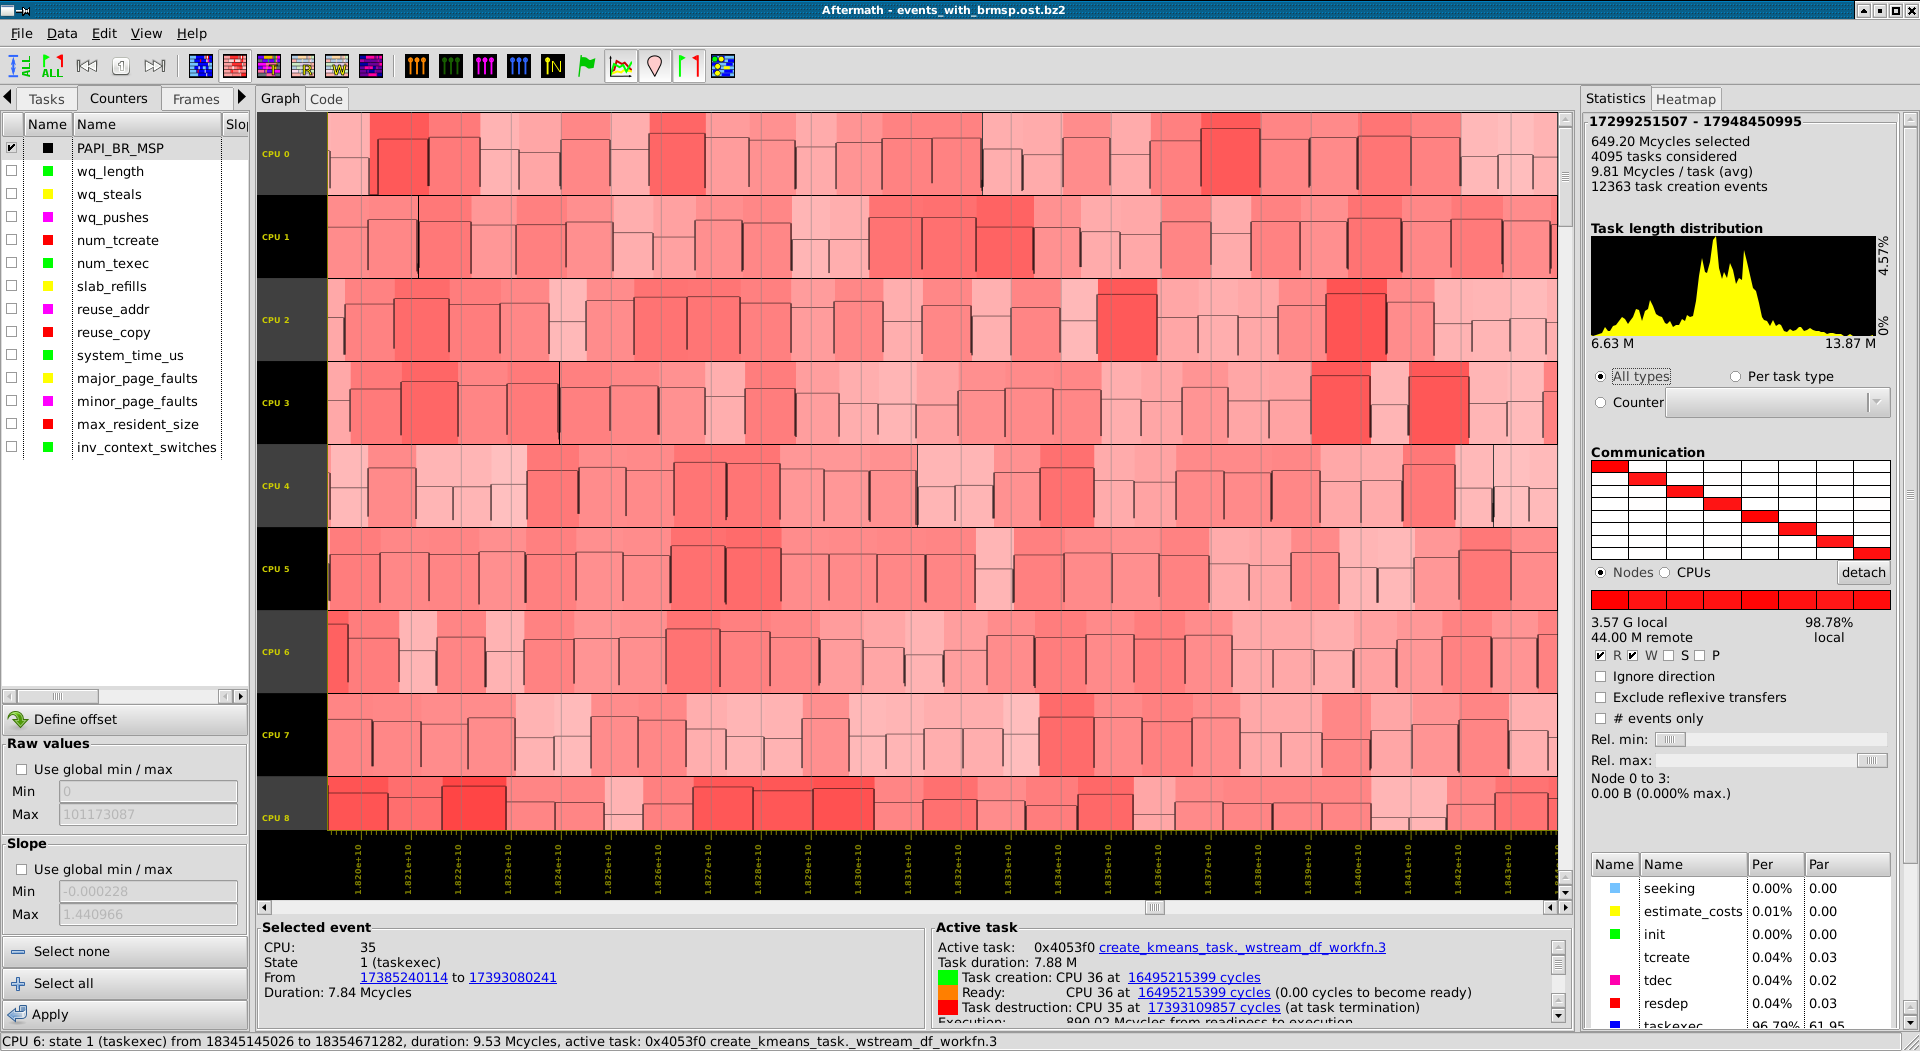
Visualization of hardware performance counters on top of the time line in heatmap mode
-
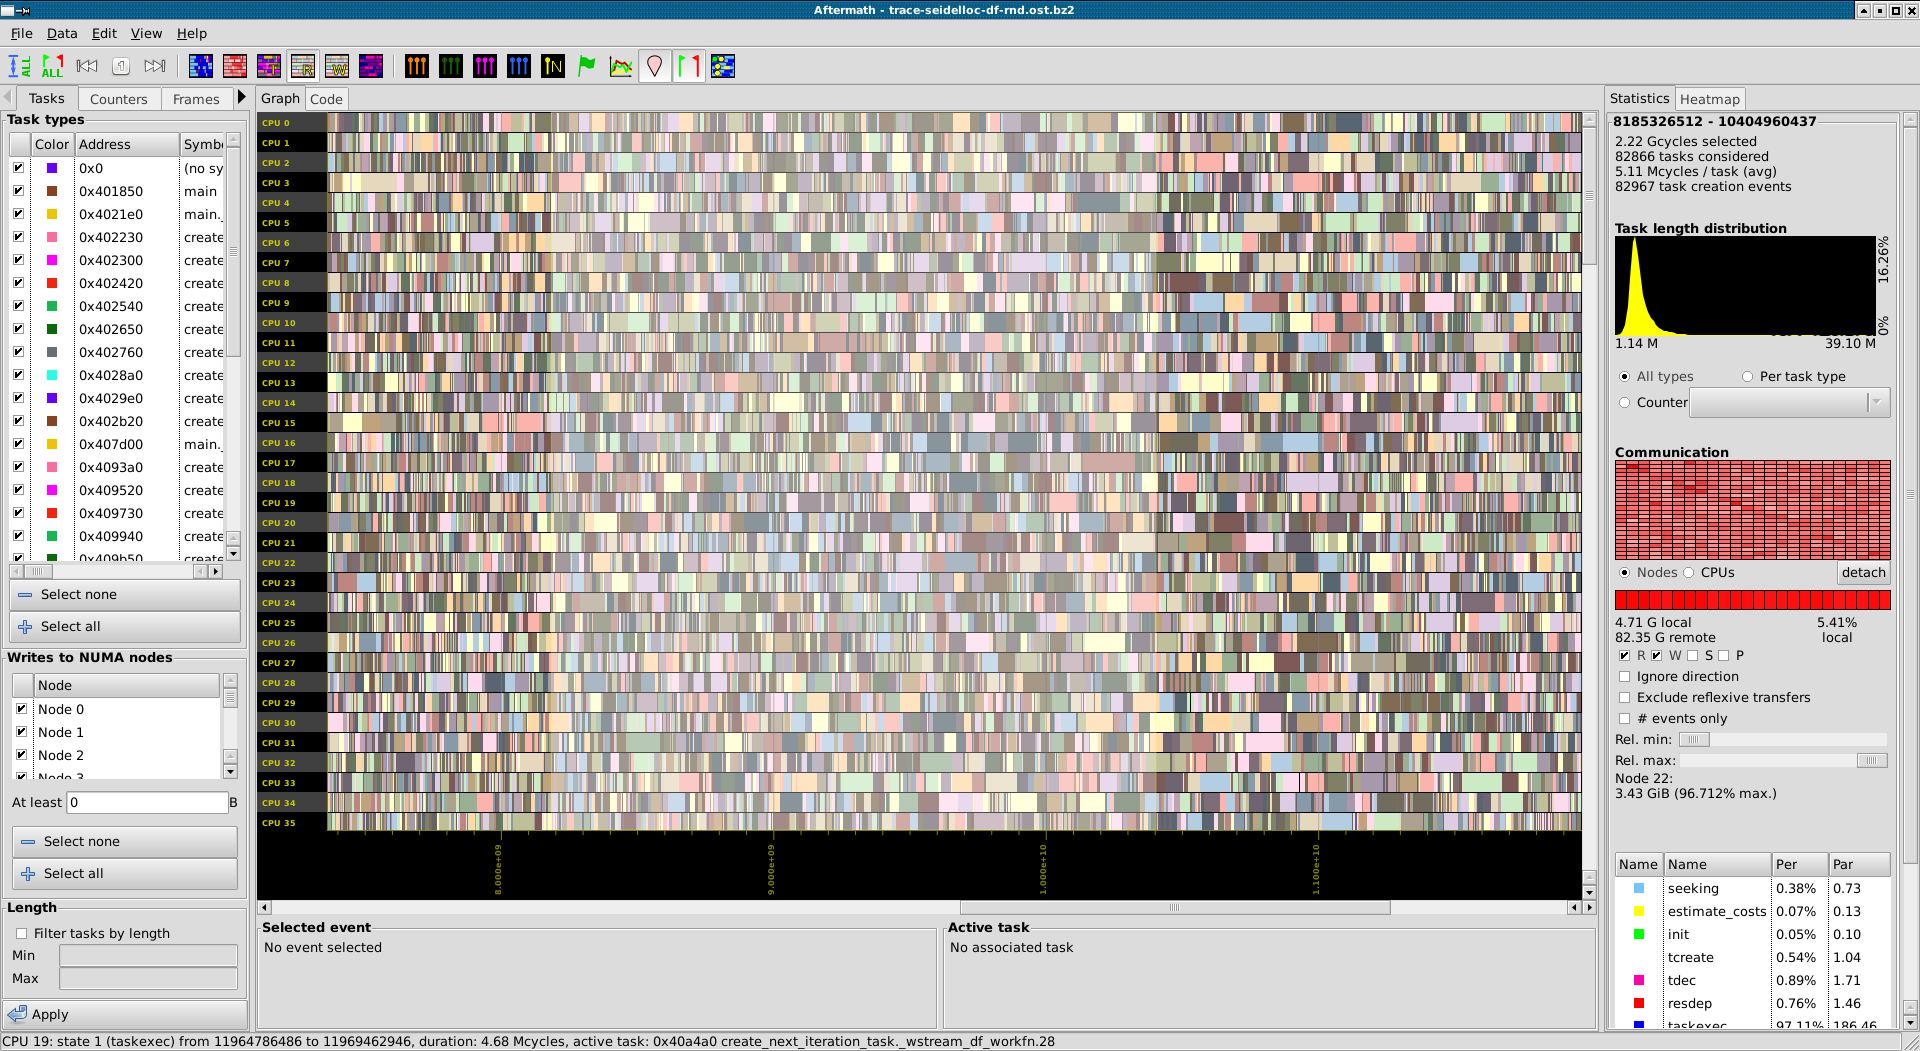
Visualization of memory accesses on a NUMA platform: the color of each rectangle indicates from which NUMA mode most of the data was read during task execution
-
Visualization of memory accesses on a NUMA platform: the color of each rectangle indicates from which NUMA mode most of the data was read during task execution
-
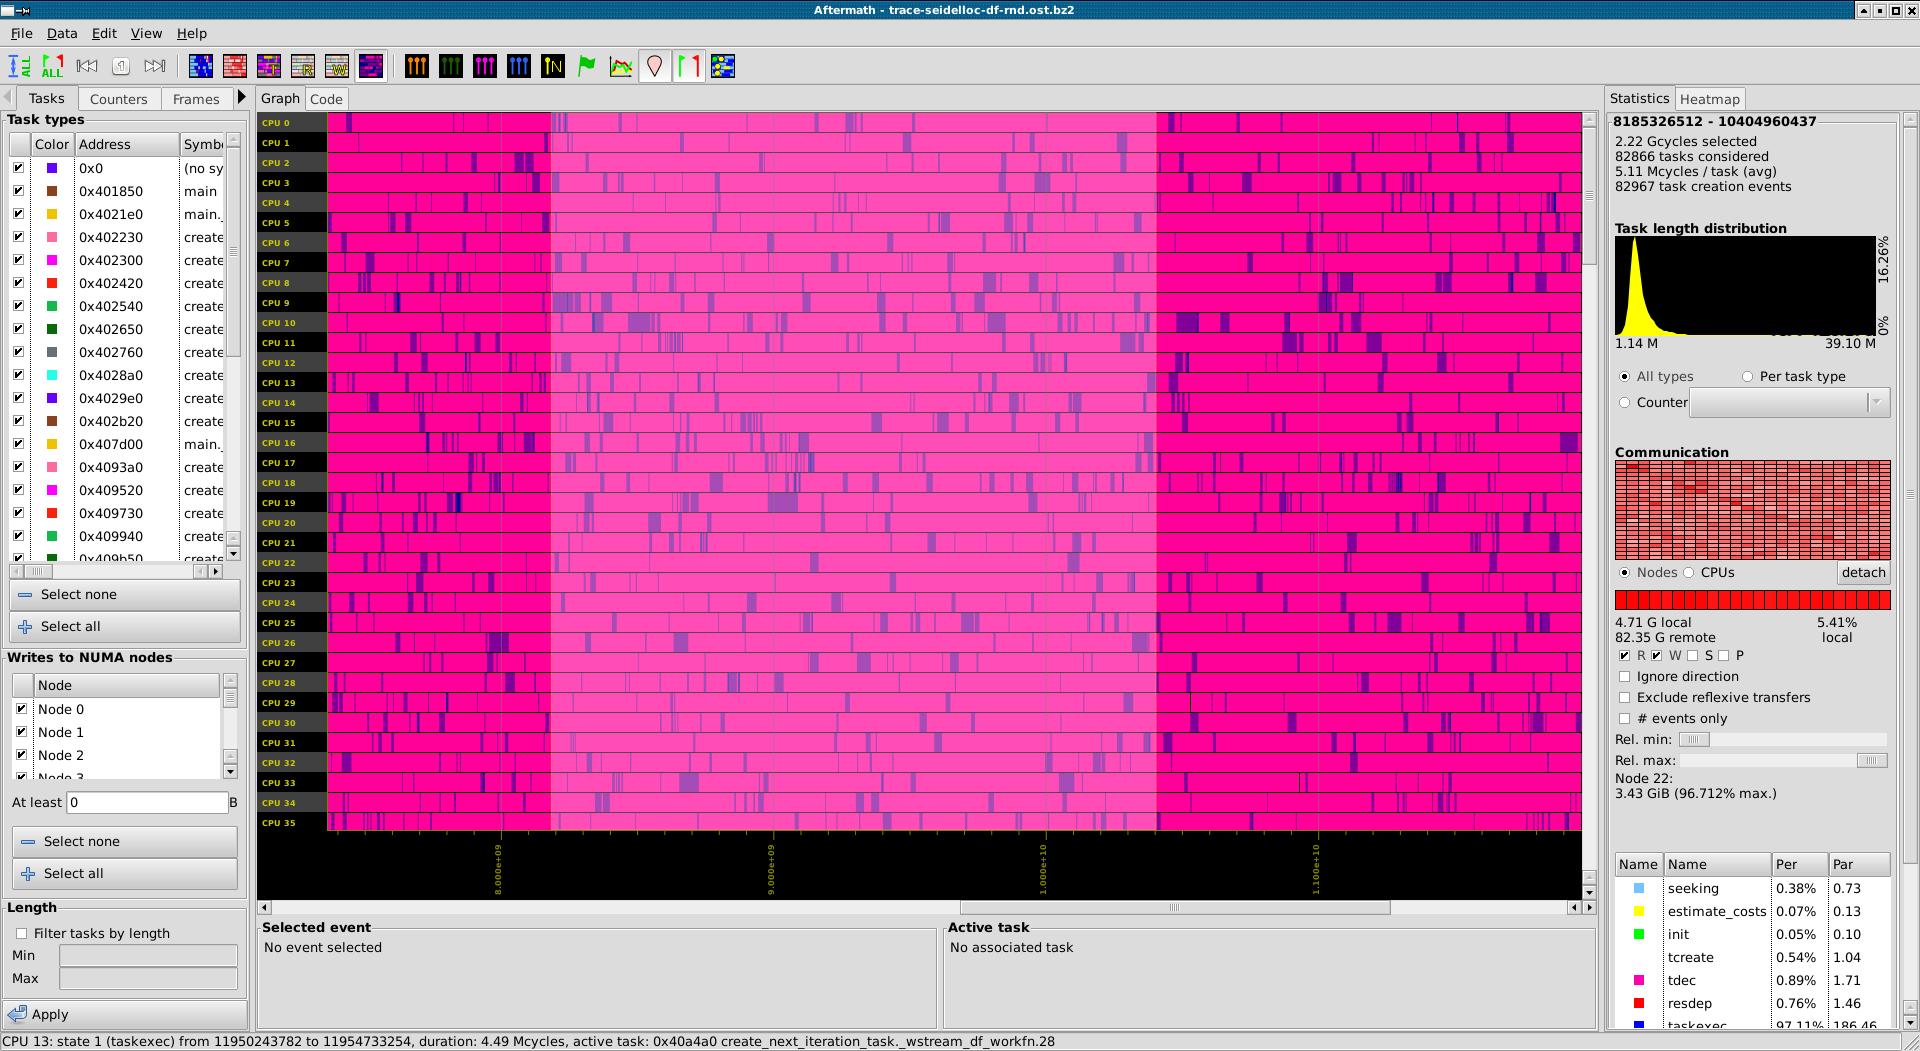
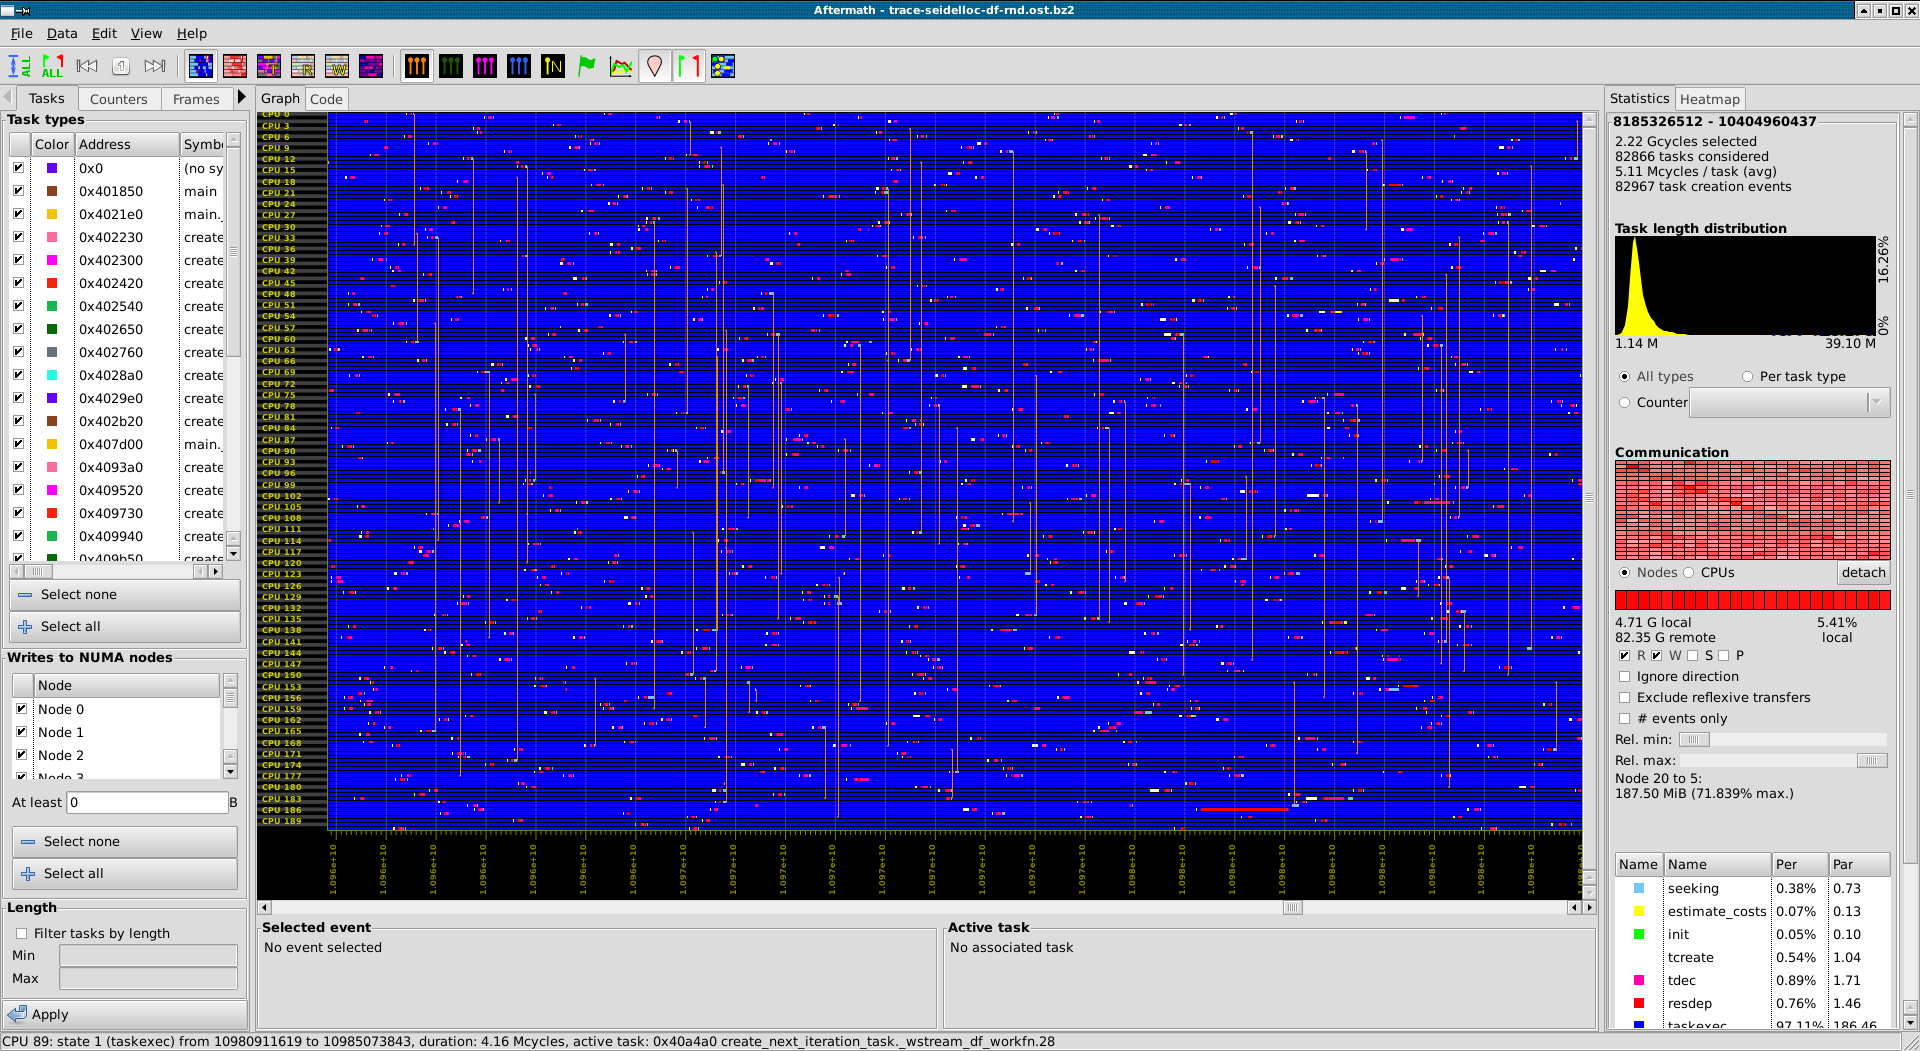
Visualization of data locality on a NUMA platform: tasks with low data locality are rendered in pink, while tasks with high data locality are rendered in blue
-
Visualization of work-stealing events on top of the time line in state mode
-
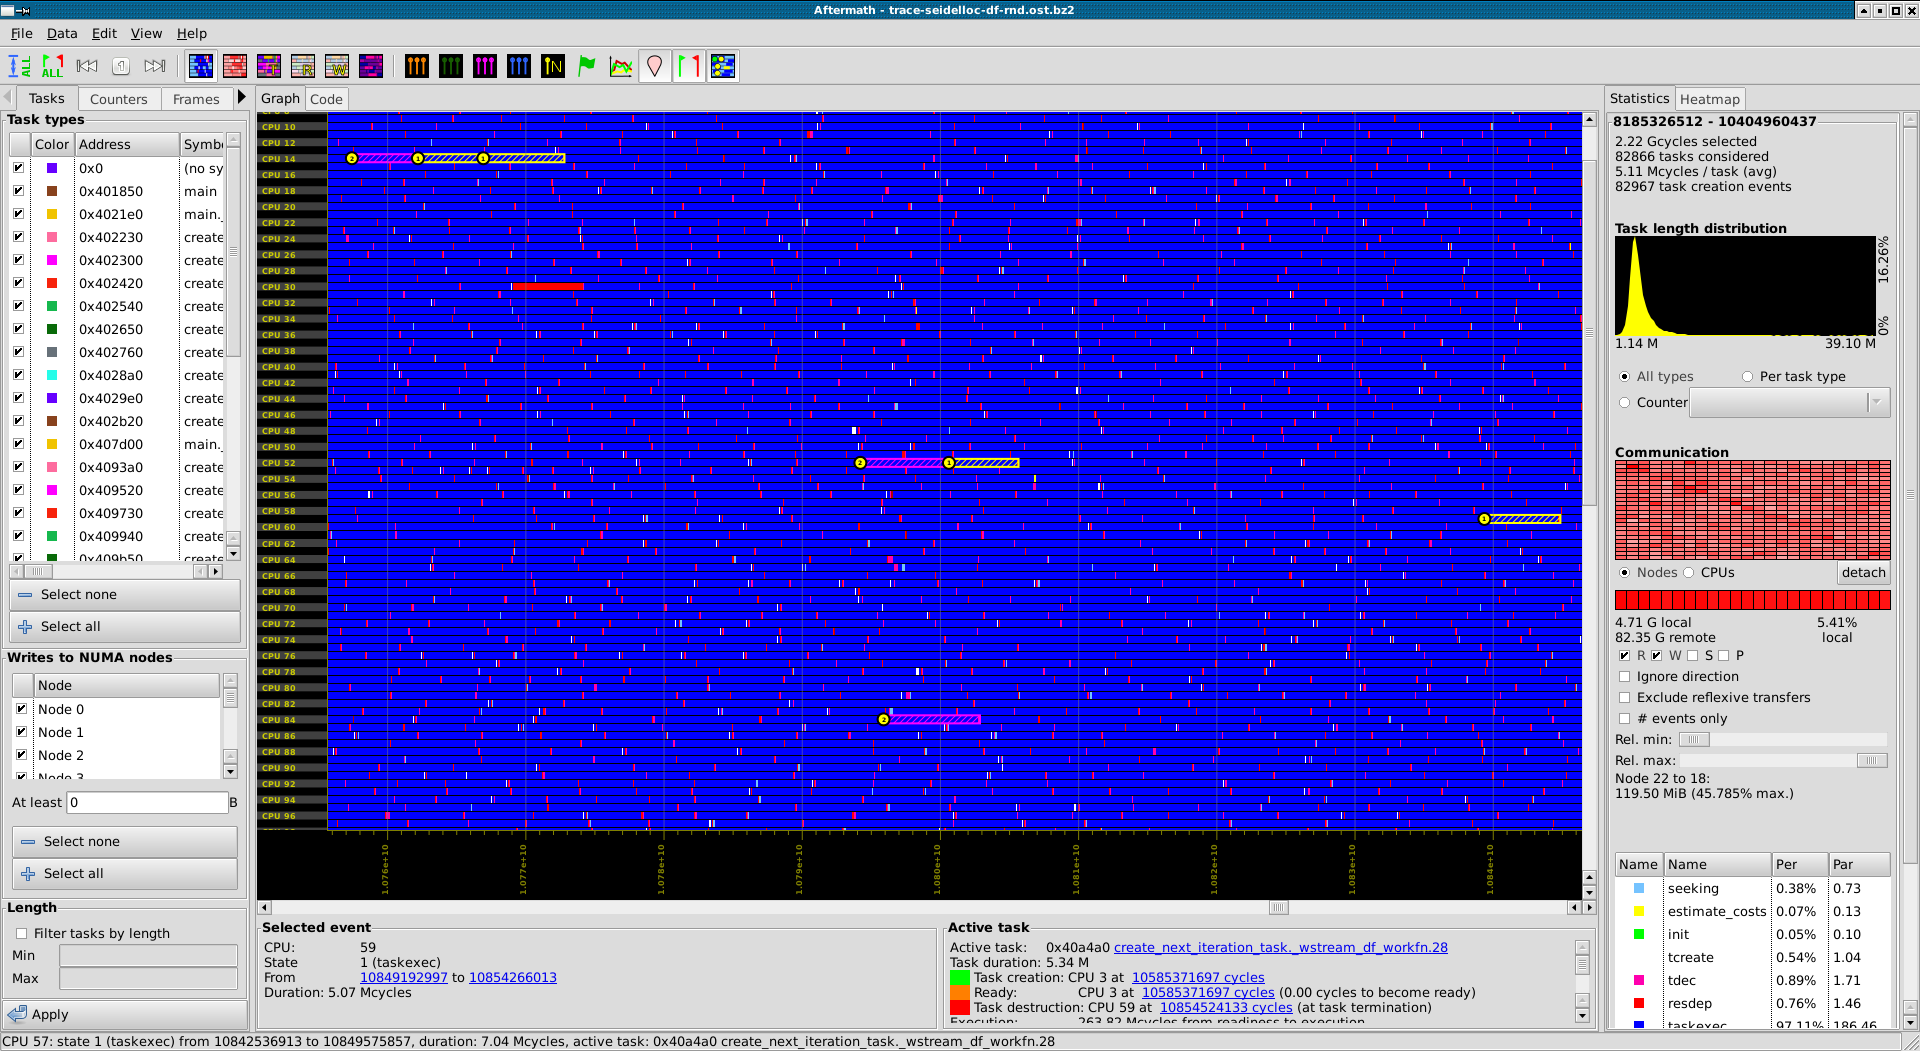
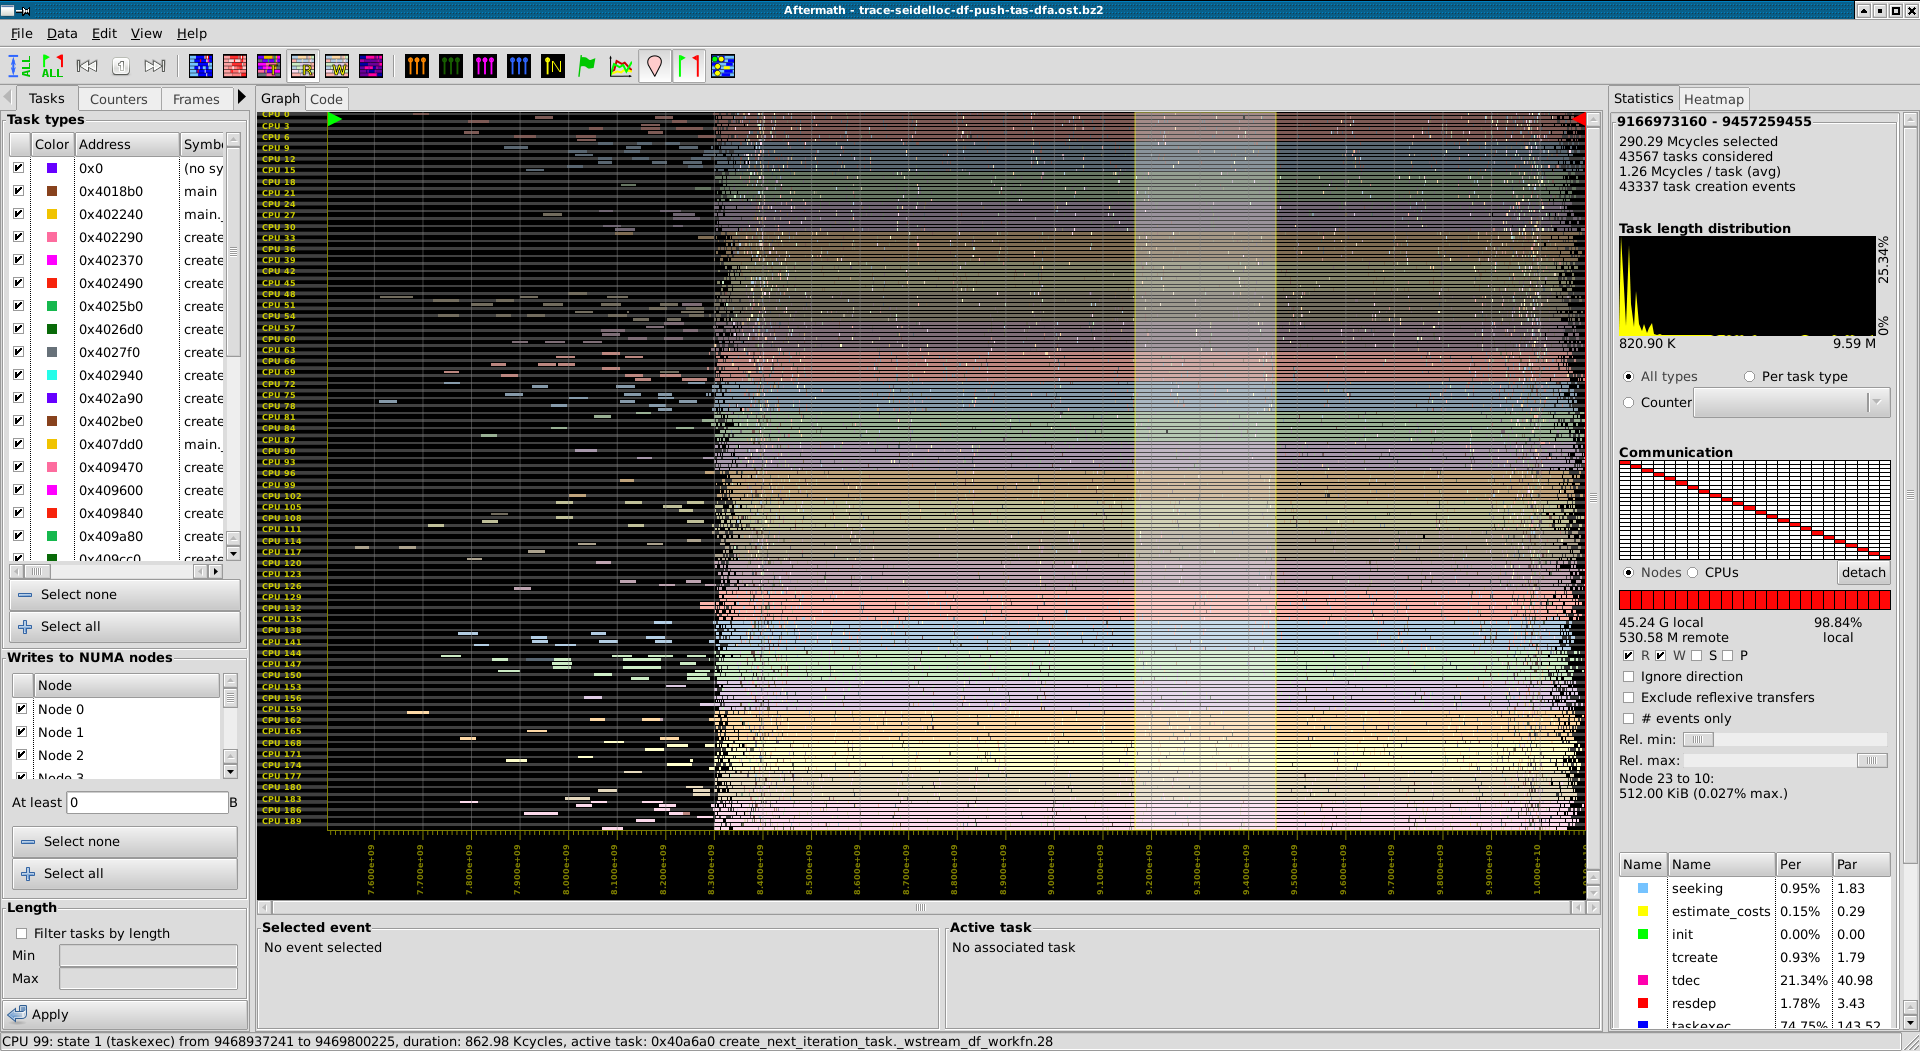
Visualization of the producers of a selected task
-
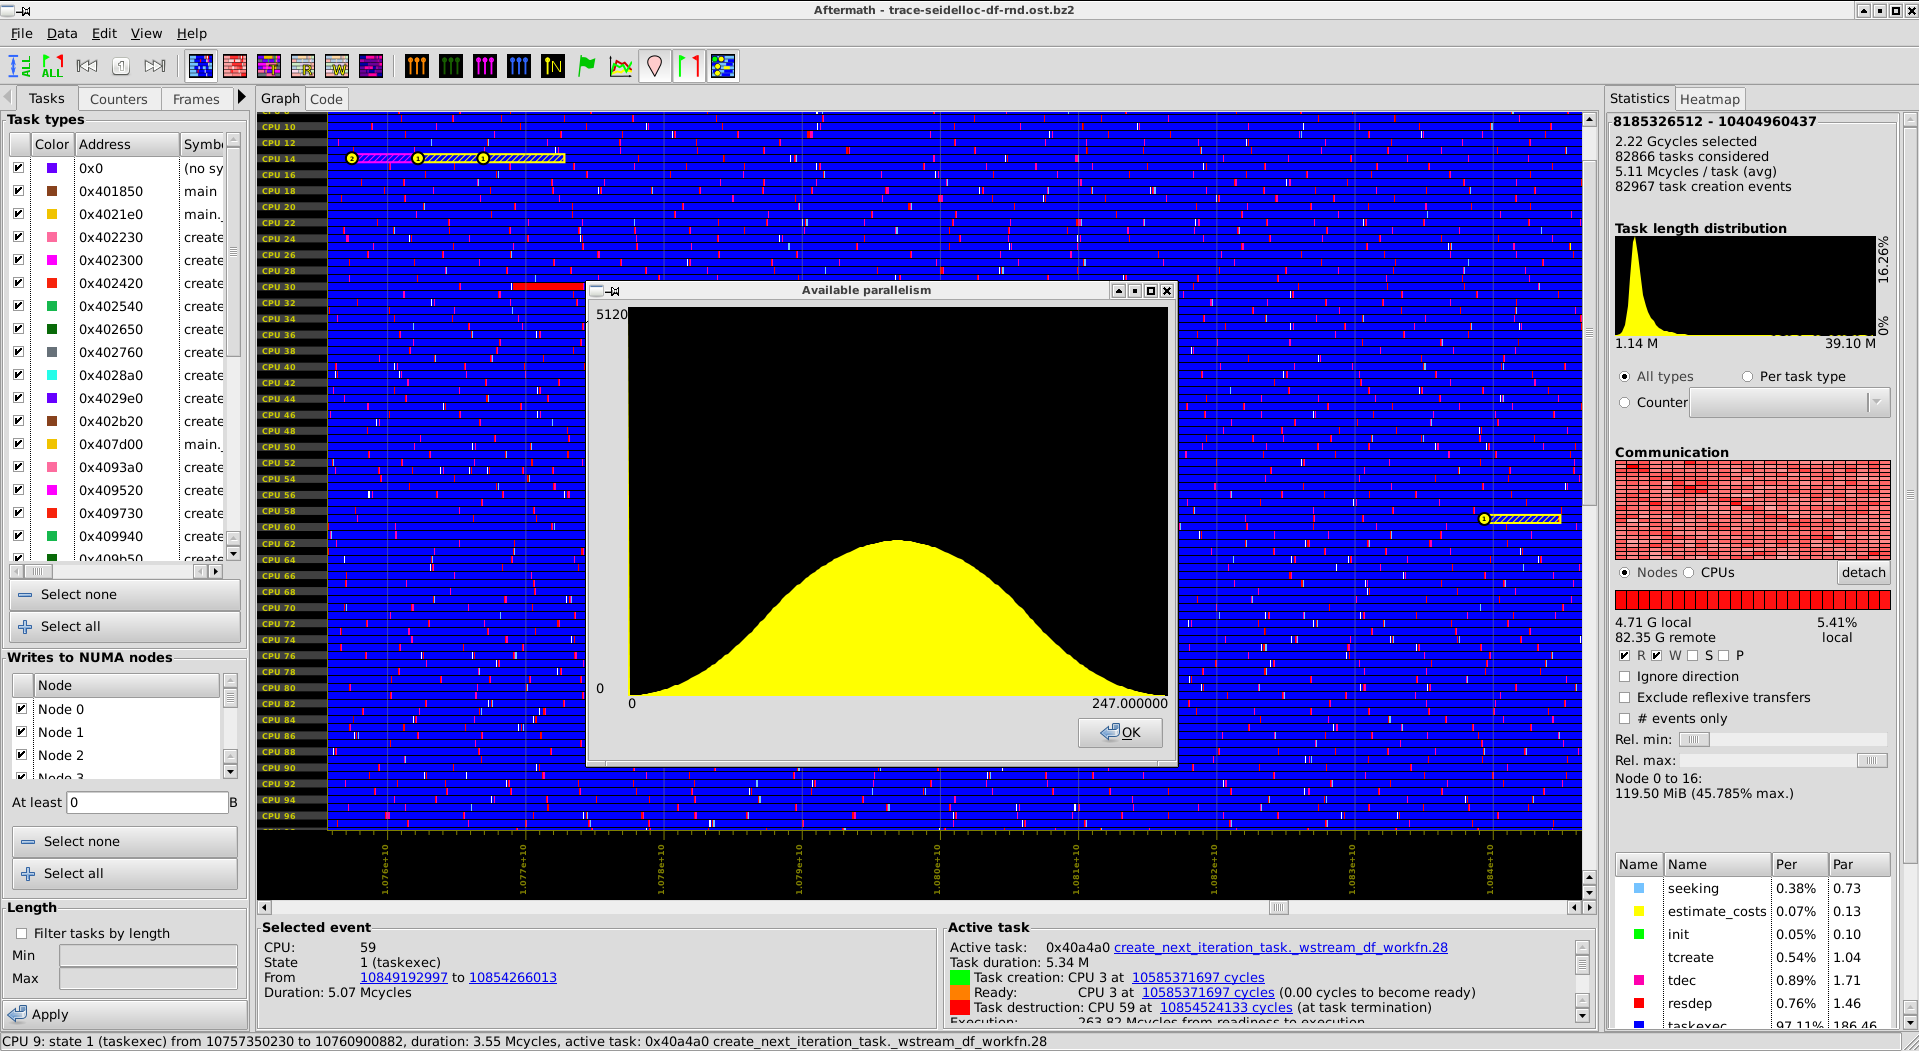
Available parallelism as a function of the depth in the task graph computed from data dependences